Inverse Propensity Score (IPS)推定量は因果推論の文脈でよく見ていましたが、傾向スコアの逆数で重みづけを行うことが何故バイアスを減らすことになるのか、ふわっとした理解できちんと理解していませんでした。
『機械学習と因果推論の融合技術の理論と実践』(齋藤 優太 著)にわかりやすい理由が載っていて目からうろこでしたので、備忘録として記載しておきます。
目次 / Contents
1. 主要概念
1.1 平均介入効果 (ATE)
平均介入効果(Average Treatment Effect: ATE)$\tau$は、ある介入が結果に与える影響の平均を表す重要な指標です。
$ \tau = \mathbb{E}[Y(1) – Y(0)] $
ここで、$Y(1)$は介入を受けた場合の結果、$Y(0)$は介入を受けなかった場合の結果を表します。
1.2 傾向スコア (Propensity Score)
傾向スコア$e(x)$は、ある特徴$x$を持つ個体が介入を受ける確率を表します。
$ e(x) = P(W=1|X=x) $
$W$は介入の有無を表す変数(0 or 1)、$X$は個体の特徴を表す変数です。
2. AVG推定量の問題点
最も単純な推定方法として、介入群と非介入群の平均の差を取る経験平均に基づく推定量(AVG推定量)があります。AVG推定量は以下のように定義されます。
$ \hat\tau_\text{AVG}(\mathcal{D}):= \frac{1}{n} \sum_{i=1}^n w_i y_i – \frac{1}{n} \sum_{i=1}^n \left(1-w_i \right) y_i $
この推定量の期待値を詳細に計算してみます。
\begin{aligned} & \mathbb{E}_{p(\mathcal{D})}\left[\hat{\tau}_{\mathrm{AVG}}(\mathcal{D})\right] \\ & =\mathbb{E}_{p(\mathcal{D})}\left[\frac{1}{n} \sum_{i=1}^n w_i y_i-\frac{1}{n} \sum_{i=1}^n\left(1-w_i\right) y_i\right] \\ & =\frac{1}{n} \sum_{i=1}^n \mathbb{E}_{p(x, w, y(0), y(1))}[w y]-\frac{1}{n} \sum_{i=1}^n \mathbb{E}_{p(x, w, y(0), y(1))}[(1-w) y] \because \text { 期待値の線形性、同一分布からの抽出 } \\ & =\mathbb{E}_{p(x, w, y(0), y(1))}[w y]-\mathbb{E}_{p(x, w, y(0), y(1))}[(1-w) y] \\ & =\mathbb{E}_{p(x)}\left[\mathbb{E}_{p(w, y(0), y(1) \mid x)}[w y]\right]-\mathbb{E}_{p(x)}\left[\mathbb{E}_{p(w, y(0), y(1) \mid x)}[(1-w) y]\right] \because \text { 繰り返し期待値の法則 } \\ & =\mathbb{E}_{p(x)}\left[\mathbb{E}_{p(w, y(1) \mid x)}[w y(1)]\right]-\mathbb{E}_{p(x)}\left[\mathbb{E}_{p(w, y(0) \mid x)}[(1-w) y(0)]\right] \because \text { 一致性の仮定 } \\ & =\mathbb{E}_{p(x)}\left[\mathbb{E}_{p(w \mid x)}[w] \mathbb{E}_{p(y(1) \mid x)}[y(1)]\right]-\mathbb{E}_{p(x)}\left[\mathbb{E}_{p(w \mid x)}\left[(1-w) \mathbb{E}_{p(y(0) \mid x)}[y(0)]\right]\right. \because \text { 交換性の仮定 } \\ & =\mathbb{E}_{p(x, y(1))}[e(x) y(1)]-\mathbb{E}_{p(x, y(0)}[(1-e(x)) y(0)] \because e(x):=\mathbb{E}_{p(w \mid x)}[w] \\ & \neq \tau \\ & \end{aligned}
この計算過程から、傾向スコア$e(x)$が現れ、推定量の期待値と真の平均介入効果$\tau$の間にズレ(バイアス)を生んでいることが明確になります。
3. IPS推定量
AVG推定量の問題を解決するために、IPS推定量が考案されました。
その核心は、期待値を計算したときに$e(x)$が消えるように逆算して設計された点にあります。
$\hat\tau_{\mathrm{IPS}}(\mathcal{D}) := \frac{1}{n} \sum_{i=1}^n \frac{w_i}{e(x_i)} y_i – \frac{1}{n} \sum_{i=1}^n \frac{1-w_i}{1-e(x_i)} y_i$
この推定量の期待値を詳細に計算してみます。
\begin{aligned} & \mathbb{E}_{p(\mathcal{D})}\left[\hat{\tau}_{\operatorname{IPS}}(\mathcal{D})\right] \\ & =\mathbb{E}_{p(\mathcal{D})}\left[\frac{1}{n} \sum_{i=1}^n \frac{w_i}{e\left(x_i\right)} y_i-\frac{1}{n} \sum_{i=1}^n \frac{1-w_i}{1-e\left(x_i\right)} y_i\right] \\ & =\mathbb{E}_{p(x, w, y(0), y(1))}\left[\frac{w}{e(x)} y\right]-\mathbb{E}_{p(x, w, y(0), y(1))}\left[\frac{1-w}{1-e(x)} y\right] \because \text { 期待値の線形性、同一分布からの抽出 } \\ & =\mathbb{E} _ {p(x)}\left[\mathbb{E}_{p(w, y(1) \mid x)}\left[\frac{w}{e(x)} y(1)\right]\right]-\mathbb{E}{p(x)}\left[\mathbb{E}_{p(w, y(0) \mid x)}\left[\frac{1-w}{1-e(x)} y(0)\right]\right] \because \text { 繰り返し期待値の法則、一致性の仮定 } \\ & =\mathbb{E}_{p(x)}\left[\frac{\mathbb{E}_{p(w \mid x)}[w]}{e(x)} \mathbb{E}_{p(y(1) \mid x)}[y(1)]\right]-\mathbb{E}_{p(x)}\left[\frac{\mathbb{E}_{p(w \mid x)}[(1-w)]}{1-e(x)} \mathbb{E}_{p(y(0) \mid x)}[y(0)]\right] \because \text { 交換性の仮定 } \\ & =\mathbb{E}_{p(x)}\left[\frac{e(x)}{e(x)} \mathbb{E}_{p(y(1) \mid x)}[y(1)]\right]-\mathbb{E}_{p(x)}\left[\frac{1-e({x})}{1-e(x)} \mathbb{E}_{p(y(0) \mid x)}[y(0)]\right] \\ &= \mathbb{E}_{p(y(1))}[y(1)]-\mathbb{E}_{p(y(0))}[y(0)] \\ &=\tau \end{aligned}
このような計算過程から、IPS推定量が$e(x)$を巧妙に相殺し、真の平均介入効果$\tau$と一致することが示されました。
4. 具体例:広告効果の測定
ある企業が新しい広告キャンペーンの効果を測定したいと考えているとします。
- $X$:顧客の特徴(年齢、過去の購買履歴など)
- $W$:広告の表示有無(1: 表示、0: 非表示)
- $Y$:購買金額
IPS推定量は、各顧客の購買金額をその顧客が広告を見る確率の逆数で重み付けすることで、広告表示の偏りを補正し、真の広告効果を推定します。
架空のデータを使ってシミュレーションしてみます。
import numpy as np
import matplotlib.pyplot as plt
from sklearn.linear_model import LogisticRegression

def generate_data(n, beta_x, beta_w, tau):
    X = np.random.normal(0, 1, (n, 1))
    p = 1 / (1 + np.exp(-beta_x * X))
    W = np.random.binomial(1, p).flatten()  # ここを修正
    Y0 = np.random.normal(0, 1, n)
    Y1 = Y0 + tau + beta_w * X.flatten()
    Y = W * Y1 + (1 - W) * Y0
    return X, W, Y

def estimate_propensity(X, W):
    model = LogisticRegression()
    model.fit(X, W)
    return model.predict_proba(X)[:, 1]

def ips_estimator(W, Y, e):
    return np.mean(W * Y / e) - np.mean((1 - W) * Y / (1 - e))

def avg_estimator(W, Y):
    return np.mean(Y[W == 1]) - np.mean(Y[W == 0])

# パラメータ設定
n = 1000
beta_x = 1
beta_w = 0.5
tau = 2

# データ生成
X, W, Y = generate_data(n, beta_x, beta_w, tau)

# 傾向スコア推定
e = estimate_propensity(X, W)

# IPS推定量と平均差推定量の計算
tau_ips = ips_estimator(W, Y, e)
tau_avg = avg_estimator(W, Y)

# 結果のプロット
plt.figure(figsize=(10, 6))
plt.scatter(X[W == 1], Y[W == 1], label='Treated', alpha=0.5)
plt.scatter(X[W == 0], Y[W == 0], label='Control', alpha=0.5)
plt.axhline(y=tau, color='r', linestyle='--', label='True ATE')
plt.axhline(y=tau_ips, color='g', linestyle='--', label='IPS Estimate')
plt.axhline(y=tau_avg, color='b', linestyle='--', label='AVG Estimate')
plt.xlabel('X')
plt.ylabel('Y')
plt.title('Comparison of IPS and AVG Estimators',fontsize=6)
plt.legend(fontsize=4)
plt.show()

print(f"True ATE: {tau}")
print(f"IPS Estimate: {tau_ips:.4f}")
print(f"AVG Estimate: {tau_avg:.4f}")
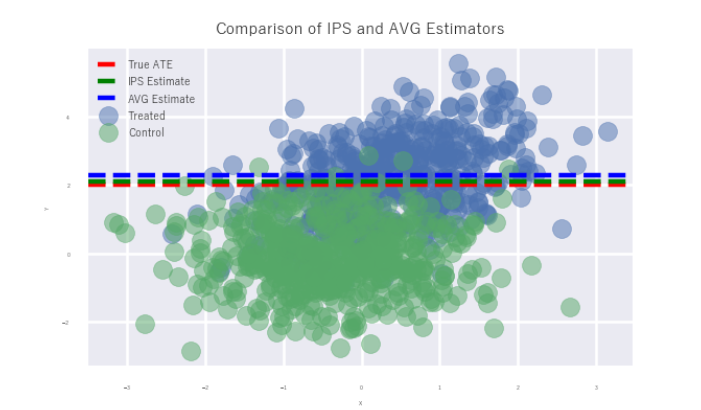
左図のように、IPS推定量(緑線)のほうがAVG推定量(青線)よりも真値(赤線)に近いことがわかります。
IPS推定量の主な限界は:
- 傾向スコア$e(x)$の正確な推定が必要
- 極端に小さい傾向スコアがある場合、推定量の分散が大きくなる
- 未観測の交絡因子がある場合、バイアスが残る可能性がある
5. 結論
IPS推定量は、傾向スコア$e(x)$を巧妙に相殺することで、観察データから因果効果を不偏に推定することを目的としていることがわかりました。
最終更新:


